Cover Crops and Soil Compaction

How to use the Smart Probe with cover crops
Cover Crops are great. Measuring what they do below ground is better.
Cover crops can change the way a field handles water, traffic, and roots, but those improvements are not always obvious from the cab. One fall can look “fine” on the surface, while a few inches down tells a different story.
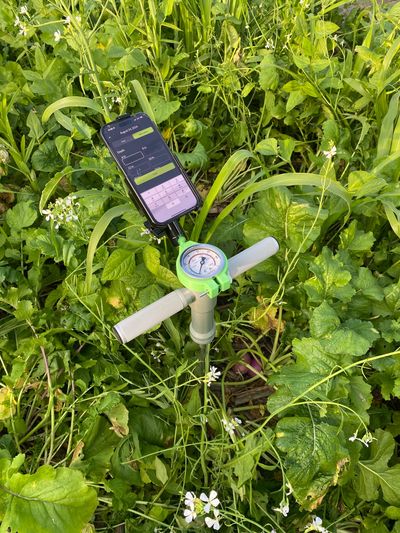
That’s exactly why we built SmartProbe. It turns a standard soil compaction probe into a GPS-enabled, depth-by-depth measurement tool using nothing more than your smartphone. You collect readings like you normally would, but the phone automatically logs the location and organizes results by depth so you can map soil resistance and compare before vs after cover crops with confidence.
What the SmartProbe adds to cover crop decisions?
When you’re running cover crops, you’re making real management bets:
- Which species or mix actually improves my soil structure in my conditions?
- Am I seeing change at the surface only, or deeper in the profile?
- Are “problem spots” getting better year over year, or just moving around?
The SmartProbe helps answer those questions by letting you:
- Build a baseline before seeding cover crops
- Repeat the same points later (spring, post-harvest, next year)
- Visualize results by depth layer (4", 8", 12", 16", 20", 24")
- Compare treatments or strips (cover crop vs no cover crop)
A simple workflow that works on real farms
Step 1: Establish a baseline (before cover crops)
The best time to build your baseline is post-harvest, before cover crop seeding, when you still have a clean look at what the season and harvest traffic did to the profile.
Pro tip: pick a repeatable sampling pattern that you can come back to:
- Strip trial (cover crop vs no cover crop)
- Management zones
- A simple grid
- Targeted areas (headlands, field entrances, wet holes, sidehills)
Step 2: Re-sample at consistent conditions
Penetrometer readings are heavily influenced by soil moisture, so the goal is not “perfect conditions.” The goal is repeatable conditions.
A practical approach is to sample:
- After a soaking rain (when the profile is more uniform)
- At a similar time window each year if you are trend tracking
Step 3: Compare by depth, not just “overall”
The value is in the layers:
- 4"–8": surface compaction, crusting, shallow traffic effects
- 8"–16": tillage zones and common traffic layers
- 16"–24": deeper resistance that can limit rooting and water movement
This is where cover crops often show their story. Some fields respond at the surface first. Others show the biggest movement deeper. SmartProbe makes those differences visible.
Step 4: Make it actionable
Once you can see resistance by depth and location, it gets easier to act without guessing:
- Adjust cover crop species/mix based on where you need impact (surface vs deep)
- Reduce passes or change timing where the field is improving
- Target compaction remediation only where it is still needed

Maximize Your Farm's Potential
What this looks like in the real world
We have worked with the Iowa Soybean Association on replicated strip trials where measurements were taken in mid-May following a soaking rain. Across four trial summaries:
- Yield-limiting compaction (>300 PSI) was rare in these datasets, showing up in only one case at a single point at 24".
- Even when yield-limiting compaction was not widespread, the data still showed clear differences between cover crop and no cover crop treatments at certain depths.
- In multiple trials, the cover crop treatment averaged lower soil resistance than the no cover crop treatment at the depths where the response was statistically significant (for example, 4" in one trial, all depths in another, and 24" in others).
Best practices for measuring cover crops with SmartProbe
Keep it repeatable
- Sample the same points or pattern each time
- Log notes: crop, tillage, rainfall, termination timing, and traffic events
Control for moisture as best you can
- Sample after a meaningful rain when possible
- Avoid comparing “bone dry” to “field capacity” and calling it a cover crop effect
Use enough points
- A few points can be interesting
- A repeatable set of points becomes decision-grade